The Grass Appears Greener to Would-be Canadian Immigrants
By Murtaza Haider
Canada
Canada should have gotten it right by now. A 146-year old country of immigrants should know how to integrate new immigrants. The recent census data however suggests that not to be the case.
While Canadians celebrated the 146th birthday of their country, many recent immigrants, however, had little to celebrate in their adopted homeland where their unemployment rate was 75 per cent higher than that of the native-born Canadians.
Last week, Statistics Canada released further details from the 2011 National Household Survey (NHS). The data focusing on labor outcomes paints a dismal picture for many immigrant groups, especially those who are considered a visible minority, a term referring to the people who visibly do not belong to the majority race at a place. For the would-be South Asian emigrants, the grass appears greener in Canada.
The labour force statistics from the NHS reveal the uneven geography of labor force outcomes for various ethnic groups. More than one in four working-age Arab, who migrated to Canada between 2006 and 2011, were unemployed. During the same time-period, one in seven South Asian immigrants was also unemployed.
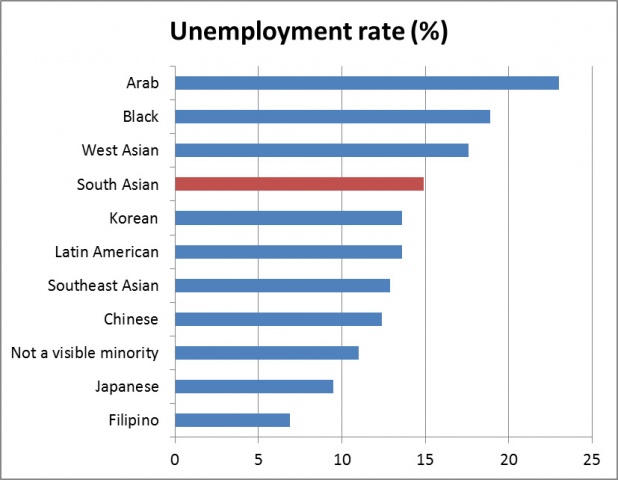
Unemployment rates for various ethnic groups who migrated to Canada between 2006 and 2011 Source: Murtaza Haider, 2013. Data from the National Household Survey, 2011.
The recent immigrants are most likely to experience adverse labor force outcomes, such as un- or under-employment. This is primarily a result of moving to a new place where one does not have networks, one is unfamiliar with the system, and one’s credentials are either not recognized at all or are not recognized fast enough for one to have a career in one’s chosen field. The result of these limitations is that recent immigrants end up working odd jobs, trying to make ends meet. Eventually, they should be able to address these limitations and improve their employment prospects. For South Asian emigrants, this happens to be the case in Canada.
The unemployment rate of recent immigrants from South Asia, i.e., those who arrived between 2006 and 2011, was 14.9 per cent in 2011. The same for those who arrived between 2001 and 2005 was lower at 10.9 per cent. Similarly for South Asians who landed in the 90s, the unemployment rate was even lower at 9.2 per cent. And finally for those who arrived in the 80s, the unemployment rate was 6.8 per cent, and for those arriving before 1981, the unemployment rate was 5.9 per cent.
The above figures offer proof for the assimilation affect in labor market outcomes for immigrants. The longer the immigrants stay in the adopted homeland, the more knowledgeable they become of the rules and customs, and are more likely to succeed in the labor markets.
Despite the assimilation effect, immigrants classified as visible minorities continue to have larger unemployment rates than non-visible minority migrants. Consider that while 5.9 per cent of those South Asians emigrants who arrived in Canada before 1981 were unemployed, only 5.1 per cent of the non-visible minority immigrants were unemployed for the same time period. The unemployment difference between visible and non-visible minorities has widened over the years in Canada.
According to the NHS, the unemployment rates of immigrants did vary significantly across Canada in 2011. The worst employment markets for South Asians were in Quebec. Consider Montreal, Quebec’s largest city, where the unemployment rate for South Asian emigrants was recorded at 14.6 per cent. On the other hand, the most favorable employment markets for South Asians were in the oil rich Alberta province. In Edmonton, Alberta’s second most populous city, the unemployment rate for South Asian emigrants was much lower at 5.9 per cent in 2011. And while the unemployment rate for Arab emigrants was over 16 per cent in Quebec, it was around 9.5 per cent in Alberta.
Education does play a role in securing better employment prospects in Canada for the immigrants. Immigrants with an earned doctorate or Master’s Degree for instance had an unemployment rate of 5.2 per cent and 7.2 per cent respectively. However, the unemployment rates for similarly educated non-immigrants in Canada were significantly lower. Consider that the non-migrants with an earned doctorate degree in Canada had an unemployment rate of merely 2.9 per cent, suggesting that highly educated immigrants, such as PhDs, had a 79 per cent higher unemployment rate than non-migrants with similar credentials. Even worse, one in 10 recent immigrants who arrived in Canada between 2006 and 2011 and had an earned doctorate degree, was unemployed.
While the immigrants are able to improve their lot over time in their adopted homelands, the initial years of struggle are always painful. And secondly, immigrants are seldom able to plug the wage gap with the native-born, irrespective of their education and skills.
It is never an easy decision to begin with. However, as professionals chart out plans to migrate to foreign lands, they should know that the grass is always greener on the other side of the border.
(Murtaza Haider, PhD, is the Associate Dean of research and graduate programs at the Ted Rogers School of Management at Ryerson University in Toronto. - Dawn)
-----------------------------------------------------------------------------